Journey maps visualize a user’s journey towards a goal, usually over time and across channels. Journey maps are a powerful tool for evaluating an experience and establishing a shared understanding among team members.
To learn how journey maps are used in industry, we surveyed more than 300 user experience professionals. In this article we share our findings on how practitioners create journey maps and their perceived success of these initiatives.
Approaches to Journey Mapping
We asked participants to select which of the following options described how they created their last journey map:
- An individual created the initial map using a digital tool (e.g., Mural, Miro, Google Sheets, Adobe Illustrator)
- An individual created the initial map in a physical setting with tangible tools (e.g., wall-mounted paper, sticky notes, stickers)
- A collaborative team created the initial map in a physical setting with tangible tools (e.g., wall-mounted paper, sticky notes, stickers)
- A collaborative team created the initial map using a digital tool (e.g., Mural, Miro, Google Sheets)
Our findings indicate most journey maps are created collaboratively with a team of individuals. Out of 259 responses, 64% (95% confidence interval: 58% to 70%) said they created their last journey map collaboratively with a team. In contrast, 36% (95% confidence interval: 30% to 42%) created the map independently. Whether the respondent worked in house at a company or at an agency seemed to have no effect on this finding. In either context, cocreating a journey map with a team is more popular than creating it individually.

Percentage of respondents who reported creating their last journey map independently vs. in collaboration with a team (Error bars represent 95% confidence intervals.)
We also found that the majority of our respondents created their last journey map with digital tools rather than tangible tools. Out of 259 responses, 56% (95% confidence interval: 50% to 62%) used digital tools like Miro or Google Sheets to create their map, whereas 44% (95% confidence interval 38% to 50%) used tangible tools like sticky notes to create their maps in a physical environment.
(Note that, because this data was collected in November of 2020 during the pandemic, it is possible that more people than normal used digital tools rather than tangible ones.)
Again, whether participants worked in an agency or in house seemed to have no effect on the data.

Percentage of participants who used digital vs. tangible tools (Error bars represent 95% confidence intervals.)
In the next section, we discuss respondents’ perceived success of their journey mapping initiatives and how these approaches (independent vs. collaborative; digital vs. tangible tools) impacted their responses.
Impact and Success Ratings
What is the organizational impact of creating journey maps? We asked practitioners to rate how successful their last journey-mapping initiative was in 7 areas. The scale was from 1=not successful at all to 5=extremely successful.

Respondent’s average success ratings for seven outcomes of customer-journey maps (The grey vertical line at 3.5 indicates our success barrier; error bars represent 95% confidence intervals.)
Across the board, practitioners rated their last journey-mapping initiative as moderately successful in 6 out 7 areas. We deemed ratings with an average of 3.5/5 or higher (70% or more) as successful. There were two areas that had significantly higher success scores than the rest: educating internal parties about painpoints or unmet needs and creating alignment among teams. One factor had a significantly lower success rating: persuading management to make internal optimizations. These findings are consistent with our knowledge about the benefits of journey mapping.
In our experience, there are many techniques to achieve these factors of success — journey maps aren’t the only way. For example, persuading management to invest efforts in creating new features can be done through communicating user sentiment as indicated by data from a survey or usability testing. This persuasion can be aided by creating journey maps that identify needs which could be targeted by future features, but that is an added benefit not necessarily the primary reason for creating the map.
Differences Between Collaborative and Independent Journey Mapping
How do respondents’ success rating differ when the map was created with a collaborative team or an individual? In most cases, we observed similar success ratings between those that created their journey maps in collaborative teams compared to those that created them independently. However, for one factor, creating alignment among internal teams, we observed a marginally significant difference (p value = .1): those who created their maps collaboratively with a team reported higher success rates for creating internal alignment. This is logical because, when a team cocreates the map (rather than being presented with it later), it is more likely to trust the insights.

Respondent’s average success ratings for seven outcomes of customer-journey maps, segmented based on whether the map was created collaboratively or independently (Error bars represent 95% confidence intervals.)
Differences Between Journey Mapping with Digital and Tangible Tools
What impact does tool selection (tangible vs digital) impact respondent’s success ratings? We did not observe a significant difference between the success ratings in those that created their journey maps with a digital tool versus tangible tools. In other words, it doesn’t matter whether you start with a digital tool or later convert your physical map into a digital copy.
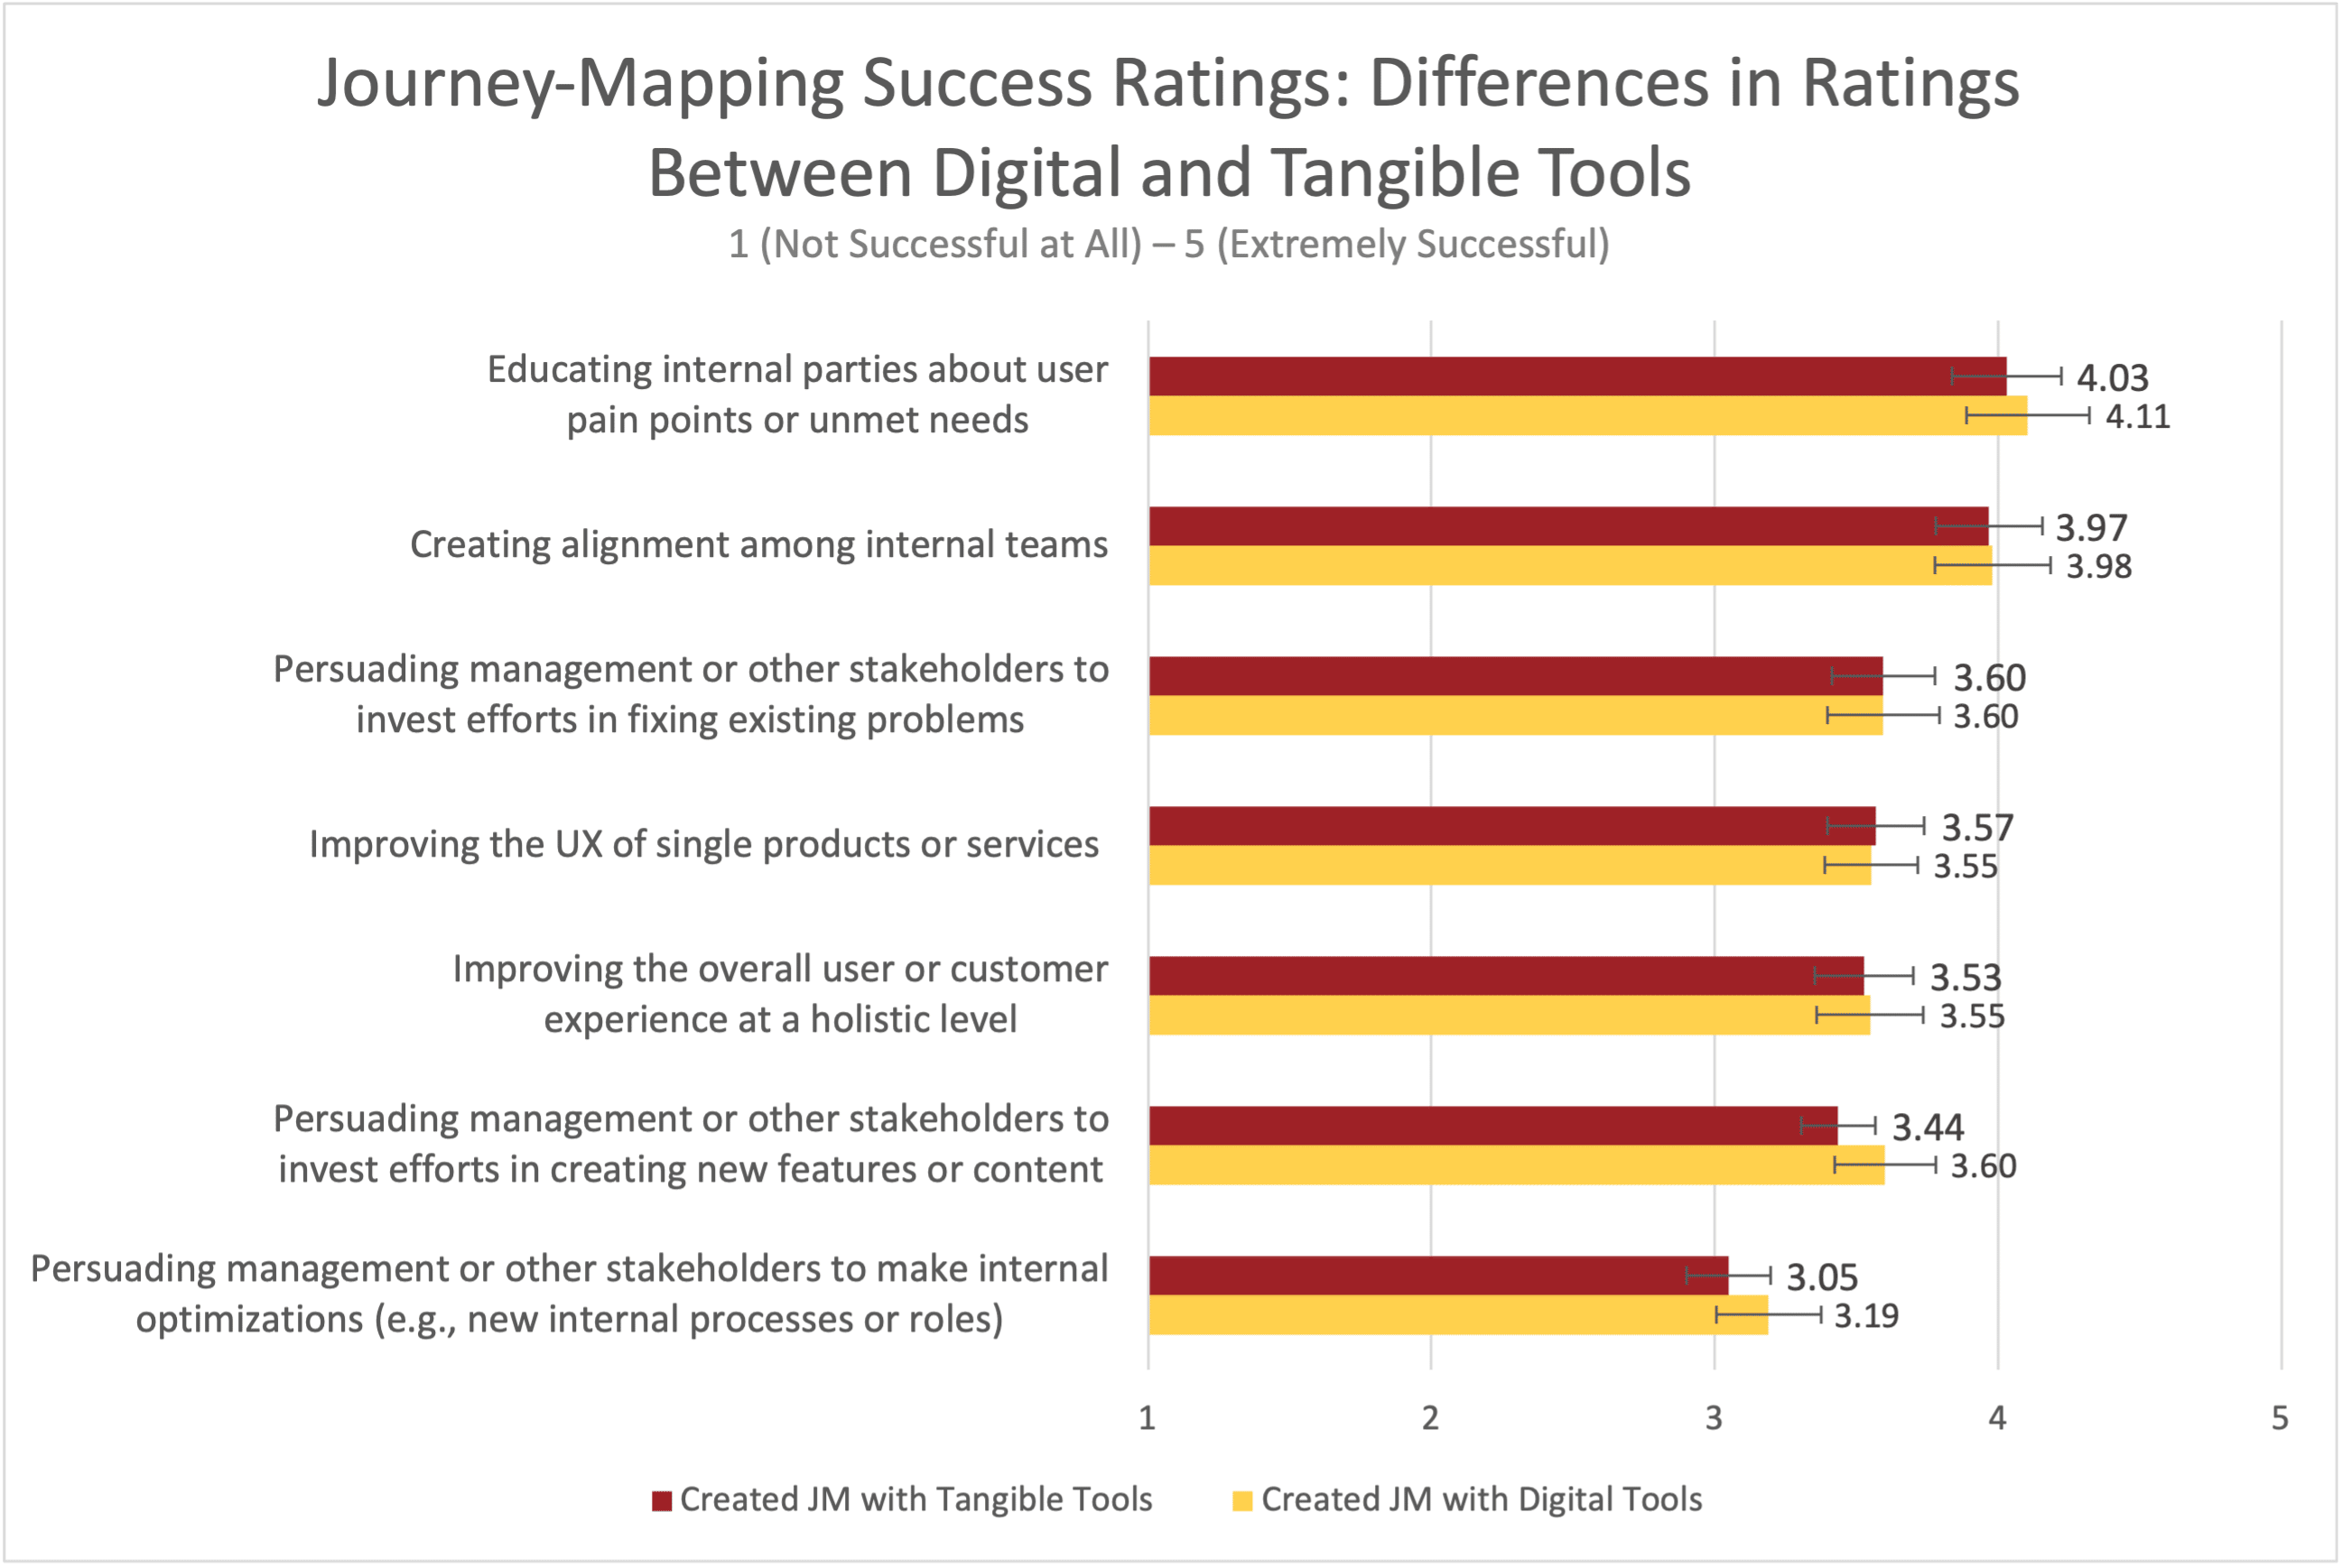
Respondent’s average success ratings for seven outcomes of customer-journey maps, segmented based on whether the initial map was created with tangible or digital tools (Error bars represent 95% confidence intervals.)
Improve the Success of Your Journey Mapping Initiative
There are many factors that will affect the success of your journey mapping initiative. For example, identifying the right scope and goals, recruiting representative participants, and identifying and prioritizing pain points will all play a role in the success of your initiative. As our research shows, neither creating your map independently nor collaboratively, or with digital or tangible tools, will guarantee you absolute success.
We asked participants (n=234) to rank 8 factors in how critical they are to successful journey mapping initiatives. The following table documents respondent’s average rank scores (high rank scores signify high importance; rank scores range from 1 to 8):
|
Factor |
Rank score |
|
Involving customers in the process |
6.08 |
|
Involving a crossfunctional team in the process |
5.81 |
|
Selecting the right journey to map |
5.21 |
|
Selecting the right persona or segment |
4.85 |
|
Choosing the right research method |
4.46 |
|
Executive sponsorship |
3.84 |
|
Rigor of research used to inform the map |
3.75 |
|
Graphically designed, visually appealing maps |
2.18 |
Interestingly, the top 4 factors that received highest rank scores make up the first step in the process we recommend for creating these artifacts. Note also that the visual design of the artifact had the lowest rank score –- though it does matter to communicating your journey, many other factors are more important.
When it comes to journey mapping in your organization, prioritize involving customers and a crossfunctional team, as well as defining the right scope (persona and journey). In a related article, we share 27 tips from practitioners on how to get started with journey mapping. The first map won’t be perfect, but use this information to help you prioritize your efforts. Equally important, after your work is complete, reflect on your practice and document what you would do differently next time. Use this insight to evolve your craft over time.
Conclusion
Whether you craft these artifacts individually or in a team, digitally or tangibly, journey maps can have a positive impact on your organization. Our research shows that journey-mapping initiatives tend to be successful at creating internal alignment and educating the team about user pain points. As practitioners, understanding the potential impact of these initiatives can help you sell and set expectations for the work.