UX practitioners often use the power of storytelling in their work — personas, scenarios, and UX stories all incorporate specific details and cause-and-effect relationships to make user needs more concrete and persuasive for designers and stakeholders. But, like any tool, these narrative techniques are risky when misused.
What Is Narrative Bias?
Narrative bias can completely change an audience’s perception of facts and data.
Narrative bias refers to people’s tendency to interpret information as being part of a larger story or pattern, regardless of whether the facts support the full narrative.
Two specific story elements are especially strong influences on our behavior and likely to trigger biased conclusions:
- Specific details that make a narrative realistic and memorable
- Cause and effect explanations, which help us understand why certain events lead to final outcomes
For example, consider the following:
Do you think the average person in the United States is more likely to have
A) A Ph.D. (doctorate) degree, or
B) A high-school diploma but no college education?
You probably chose “B” almost immediately. After all, attending high school is compulsory, while becoming a Ph.D. is both optional and unnecessary for most professions. And you’re right: according to a 2022 survey conducted by the US Census Bureau, about 29% of adults in the USA are high-school graduates with no college education, but only 1.9% have a doctorate degree.
While this question is quite easy to answer correctly, a slight change makes it much more difficult. Imagine you were instead asked the following:
A visitor reading an article on the New York Times website is more likely to be:
A) Someone who holds a Ph.D., or
B) Someone who graduated from high school but did not attend college
The inclusion of a single detail — the fact that the person in question is reading an online New York Times article — is enough to make many of us disregard common sense and instead imagine a story about who this person is: because she’s reading an ‘intellectual’ newspaper, she’s more likely to be highly educated.
The percentage of Ph.D. holders might be higher among New York Times readers than among the general population, but statistically speaking, the probability that any given individual reading the New York Times holds a Ph.D. is still low. After all, the OCED estimates only 1% of the world has a Ph.D. (roughly 78 million people); meanwhile, the New York Times estimates that it has 145 million unique global visitors each month. The tendency to rely on narratives to understand the world is so strong that we make up explanatory stories based on even the flimsiest of foundations.
The Power of Details: Base-Rate Neglect
Good storytellers know that including specific details is essential to capturing the listener’s imagination and making a story believable. The problem arises when the audience latches on to a limited set of details and fails to consider the big picture.
The New York Times example is an instance of the phenomenon mentioned above and represents a type of narrative bias called base-rate neglect.
When asked about a general case (what’s a more common level of educational achievement), we naturally consider the prevalence, or base rate, of educational achievement among the entire population. But in the presence of a specific detail (such as the act of reading the New York Times), we often ignore the base rate and instead make up a story that fits the specific details and which we believe because it includes those details.
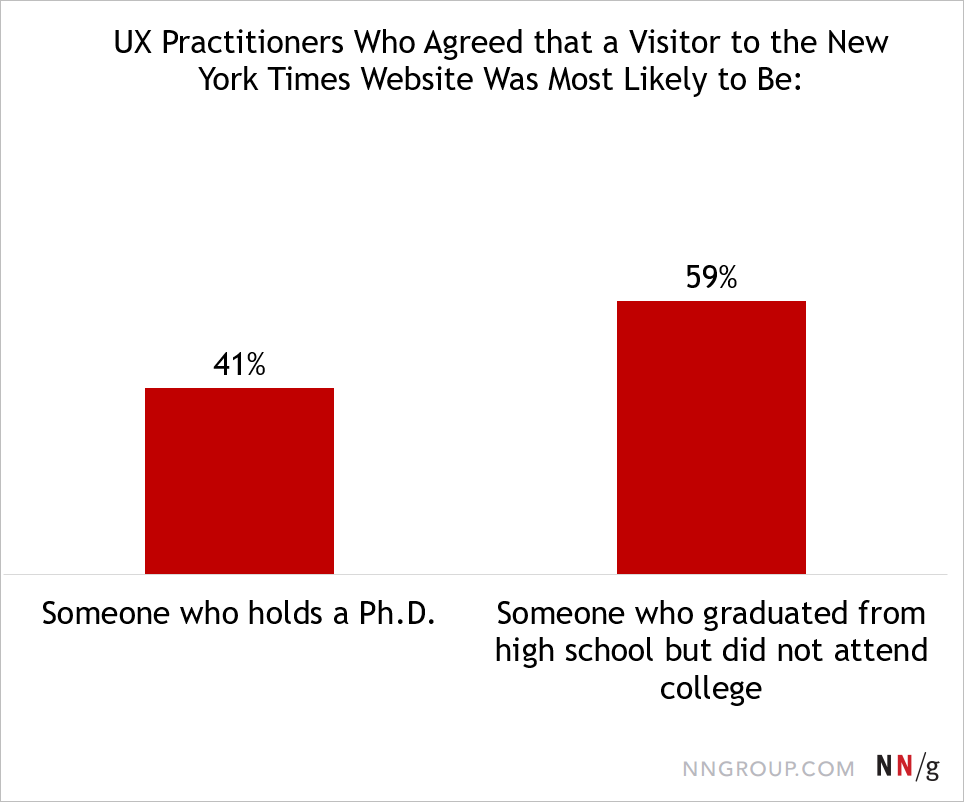
In fact, of the more than 1,000 UX practitioners who answered this question, 41% chose “A” — that the person was more likely to hold a Ph.D.
Cause and Effect
Stories that explain why things happen are a special case of the power of details. We like to believe that the world makes sense and that events have a root cause. This bias makes us more likely to believe stories that provide a causal explanation, regardless of whether the explanation is true.
Imagine you are faced with the following situation:
The analytics for a company intranet show that the Bi-Annual Audit Integrity page has the second-highest exit rate of all intranet pages. This page, which has very few visitors, describes the procedures used during the company audit. Which of these is the most likely explanation for the high exit rate from this page?
A) The exit rate is high because of poor content and/or visual design.
B) The high exit rate on this page is just random variation.
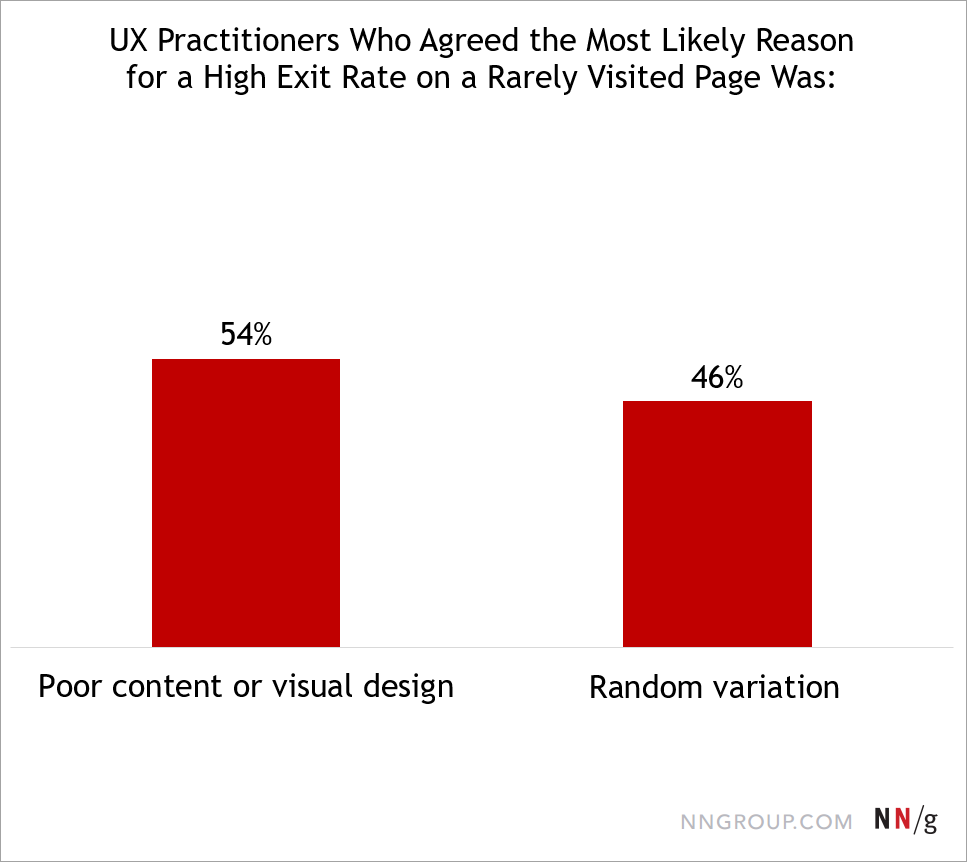
When faced with this choice, most people believe the first option is more likely. In fact, 54% of UX practitioners chose option A because it tells a meaningful story with a cause to explain the observed effect. (Another bias may contribute to this answer choice — the availability bias, which makes people use whatever examples they can easily think of to estimate probabilities. If you’ve encountered situations where poor content or visual design led to high exit rates, then these examples will be easy to recall and seem more probable.)
Often, we prefer to believe that there is a cause — any cause — rather than believing that the universe is random and things happen for no reason. After all, if there’s a cause, then we have a chance of correcting the problem.
But notice that the question asks about a page with very few visitors.
This means that the observed effect — a high rate of people who leave the intranet after viewing a certain page — is based on the behavior of just a few people. Small samples frequently generate extreme and misleading data. For example, if only 4 people visited the page, you could easily see a 100% exit rate purely due to accidents of timing.
It’s easy to overlook sample size and instead look for a story that explains why events happened. But a few instances should not be presumed to represent meaningful behavior patterns unless there is specific contextual information to the contrary. (For example, if you conducted a usability test and 4 out of 5 users assigned to find the Bi-Annual Audit procedures commented that the page seemed out-of-date, then you would have reasonable grounds to assume a causal relationship.
Narrative Bias in Practice
The questions used in our survey are simplistic examples with little context; in reality, you would look at the actual page content and design rather than trying to interpret an exit rate in a vacuum. Our biases are not as obvious in these rich-context situations, but this makes them more dangerous.
Often, we make decisions based on only a small amount of information. Our bias towards seeking and believing in causes may lead us to waste time ‘solving’ insignificant problems. Our tendency to seize on details and elaborate them into complete stories can lead us down the wrong path. For example, if we know our audience is primarily composed of young people, we might assume that because millennials and gen Z were exposed to technology at an early age, they will be able to figure out any interface, even if it’s poorly designed. While the idea of 'digital natives' makes a good story, in actuality, we observe plenty of situations where young users struggle and fail with poor designs.
Conclusion
Just knowing that narrative biases exist won’t prevent you from being affected by them. You can’t stop yourself or your team from believing stories — but you can take steps to ensure that the stories you tell are true:
- Explicit Stories: When deliberately constructing stories that will be used for UX design, do your homework. Include memorable details, but base them on actual user research, preferably derived from multiple data sources and methods. Even if time constraints preclude full empirical personas, check your basic assumptions against readily available data, such as analytics or sales figures, or run a quick survey.
- Implicit Stories: Instead of relying on unstated assumptions and imagined narratives, incorporate a formal ‘problem definition’ phase into your workflow — even for minor design decisions. Forcing yourself to articulate and challenge your assumptions can ultimately save time by avoiding unnecessary or misguided solutions.