

Our team at Cisco uses the Recommendation Adoption Score (RAS) developed by Brian Utesch and Tammi Fitzwater. It helps us track the adoption of research recommendations and decide the optimal allocation of our research bandwidth.
We use a 5-step process and an Excel sheet to implement the framework. The UXR leadership and researchers partner to implement it. Researchers document recommendations and update their status based on whether teams have committed to, adopted, or ignored them. Later, UXR leadership monitors these adoption trends to identify organizational patterns. This article shares a glimpse into our setup and offers guidance for you to introduce the same. Follow along this article and use this template to get started.
- RAS Process
- Step 1: Log and Track Recommendations over Time
- Step 2: Check the Rate at Which Recommendations Are Created
- Step 3: Check the Adoption Rate of Recommendations
- Step 4: Review the Signals About How Research Resources Should Be Allocated Across Projects
- Step 5: Adjusting the Investment-Signal Criteria
RAS Process
The RAS formula gets leveraged in our 5-step process, which is as follows:
- Researchers log their recommendations and track their journey to the adoption stage.
- The UXR leadership checks the rate at which recommendations are created across all projects every month.
- The UXR leadership checks the adoption rate of recommendations (RAS) across all projects every month.
- The UXR leadership reviews the investment signals about how research resources should be allocated across projects every month and makes allocation decisions based on long term trends.
- Based on the observed metrics, the UXR leadership changes the investment signal criteria as needed.
Step 1: Log and Track Recommendations over Time
After a research readout, the researchers enter their recommendations in the Excel template. Over time, the researchers will have to check in with the stakeholders whether recommendations are being adopted or not. This creates accountability and develops a habit of following up with stakeholders.
Excel Template Guidelines
In the Recommendation list tab, enter recommendations along with the following details:
- Project: Area of work
- User Value: Weight of each recommendation (High, Medium, or Low) based on the potential impact to the user
- Status: Current state of the recommendation ̵̵̵̵–whether it has been Communicated, Committed, Adopted, or Canceled
- Description / Comments: Relevant context, reasoning for status changes, or stakeholder feedback
- Date Communicated: When the recommendation was first shared
- Date Fixed: When the recommended solution went live for users and the status of the recommendation was changed to Adopted
- Duration: Days from communication to adoption (automatically calculated)
- Evidence (Report Link): Link to research report supporting the recommendation
- Researcher Name: Who on the research team owns this recommendation
Step 2: Check the Rate at Which Recommendations Are Created
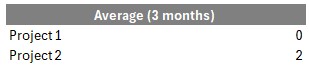
Every month, the UXR leadership monitors the rate at which the recommendations are being produced. This step helps the leadership gain insight into which projects have active ongoing research, and which ones do not. We advise you to focus on long-term trends, instead of concentrating on the monthly results.
Excel Template Guidelines
In the Recommendation velocity sheet, the velocity is automatically calculated using a pivot table, based on the Date Communicated column from the Recommendations list tab.
Step 3: Check the Adoption Rate of Recommendations
Every month, the UXR leadership should review the recommendation-adoption rate across projects. The goal is to understand which teams are adopting research and where the implementation is stalled.
Excel Template Guidelines
- The monthly RAS and the trends are in the RAS sheet.
- RAS is calculated by excluding the Canceled recommendations — the table is set to exclude them by default.
- Every month, copy the current RAS score into the RAS trends table.
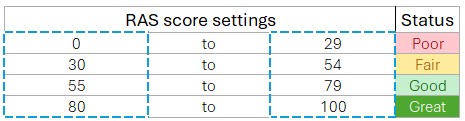
- The rating scale for RAS categories can be adjusted in the Threshold setting sheet to suit your context.
Step 4: Review the Signals About How Research Resources Should Be Allocated Across Projects
The RAS trends from the previous section are a good starting point to understand which teams are adopting research. The framework considers not only if recommendations are being implemented, but also if research is able to continuously deliver new value.
There is an additional framework that considers the 3-month average recommendation velocity, the last shift in RAS monthly metric (whether it is going up or down or no change), and the current month’s RAS status (Great, Good, Fair, Poor). It generates an Overall investment signal that can provide guidance on whether to stop or continue the research investment in a project. As with other metrics, it is important to not over-index on one month’s investment signal but rather observe the overall trend.
Excel Template Guidelines
The Excel implementation of the investment signal is determined through two separate components — one based on recommendation velocity and one based on the RAS monthly change.
Here are the steps to get those two components and the overall signal. All the calculations are in the tab Investment signals.
The Recommendation-Velocity Component
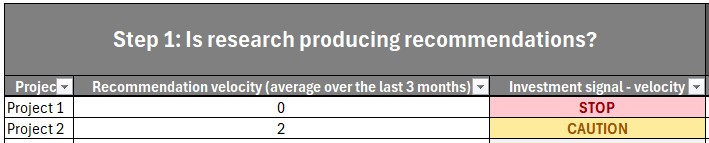
Every month, the UXR leadership enters the 3-month average volume of new recommendations within each project in the Is research producing recommendations? table. (These numbers can be extracted from the Recommendation velocity tab of the template). The velocity component is automatically calculated, using a formula that can be adjusted according to needs (see Step 5).
The RAS-Trend Component
Every month, the UXR leadership enters last month’s and this month’s RAS for each project in the Are recommendations being adopted? Table. These numbers can be extracted from the tab RAS. The RAS-trend component is automatically calculated, using a formula that can be adjusted according to needs (see Step 5).

Overall Investment Signal
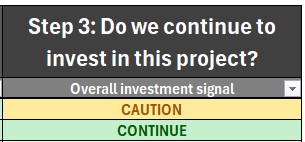
This signal gets auto generated in the Do we continue to invest in this project? table, based on the components above and a formula that can be adjusted as needed (see Step 5). Avoid making investment decisions based on one month’s investment signal. Instead, watch the longer-term trend.
Track the Investment Signal
Every month, the UXR leadership enters the overall allocation signal in the Investment signals trends sheet. Over time, this tab gives leadership a quick visual of how the investment signal has shifted over time. Consider stopping research in areas which have a continuous STOP for 6 months (or for another duration that feels appropriate for your context).
In case you want to adjust the investment-signal criteria, consider following the next step.
Step 5: Adjusting the Investment-Signal Criteria
After a few months of tracking recommendations and monitoring the RAS and investment trends, the UXR leadership can adjust the investment criteria as needed.
If your organization produces few but high-impact recommendations or if your projects are staffed with more researchers, consider changing the formula for calculating the recommendation-velocity component of the investment signal.
Depending upon your organization’s monthly RAS shifts, you can also consider changing the formula for the RAS-change component of the investment signal.
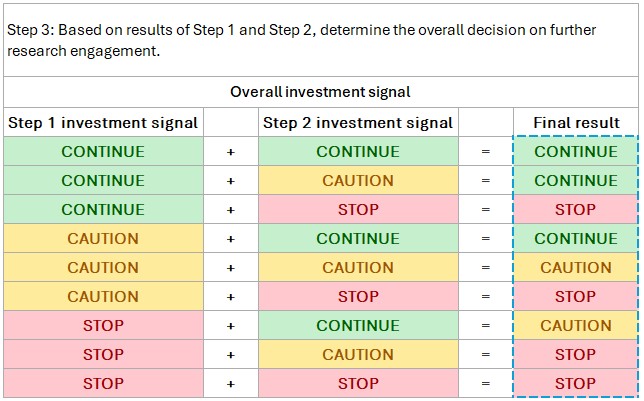
The overall investment signal gives equal weight to its two components. This formula can also be adjusted as needed.
Excel Template Guidelines
Go to the Threshold settings sheet to change the investment-signal criteria.
Changing the Recommendation-Velocity Component of the Investment Signal
Currently, this component is calculated as follows:
-
- 0–1 recommendation per month: STOP (stop the allocation since research activity is too low)
- 2 recommendations per month: CAUTION (the activity is lower than expected)
- 3+ recommendations per month: CONTINUE (the research is active and producing recommendations)
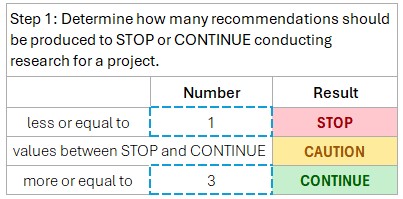
You can change the calculation of this component by changing the blue-border cells in the image above.
Changing the RAS Change Component of the Investment Signal
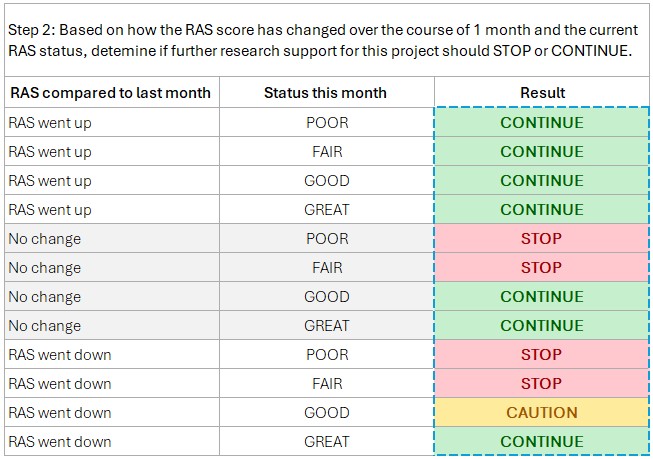
The current calculation depends on this month’s RAS status and on how it compares with the previous month’s value. The calculation is described in the figure below and can be adjusted as needed by changing the values in cells with the blue dashed border:
Overall Investment-Signal Calculation
The current calculation is described below; adjust as needed:
Final Thoughts
The main benefit of the RAS framework is the cultural shift it brings. Manual logging and tracking create a feedback loop, encouraging researchers to follow up with stakeholders and keeping research visible to product teams. Standardized tracking shows "breakage" points in the development cycle and measuring adoption changes researchers’ role from delivering reports to owning the outcome. We are excited for you to start your journey of tracking research impact.