

In the first article of this series, we defined research breakage as the gap between recommendations and actual change. While breakage is real, spotting it is tricky without data. A vague spreadsheet or a status line in a slide does not cut it. Without structure, adoption gets overstated, breakage stays hidden, and sooner or later credibility takes a hit.
This is where the recommendation-adoption score, or RAS, comes in. We developed the RAS as a real-world metric to track breakage in our work at Cisco (See the template here). But the RAS is more than just a number: it tells you how much of the value you worked to create actually reaches the user.
Treat Recommendations like Inventory
Retailers track products through every stage of the supply chain. If something breaks along the way, they want to know where and why. Design recommendations that come from research should be treated in the same way. Each recommendation represents time, energy, and money. Each one is a unit of value that either reaches the user intact or is lost.
That means a design recommendation cannot be fuzzy. It needs a clear description that someone could test later. It needs to identify exactly which user problem it solves and why that problem matters. It needs to be tied back to the evidence, following the chain from data to findings, to insight, to recommendation. Just as importantly, it needs a definition of “done” that is specific enough to prevent creative reinterpretation. If you cannot tell whether a recommendation shipped as intended, it is already at high risk of breakage.
Assign Real Ownership
In retail, if a shipment arrives damaged, someone logs it, reports it, and prevents it from happening again. “The warehouse” is not the owner. A person is.
The same is true for research. “The team” is not enough. Every recommendation should have a named owner who has both authority and accountability. That might be a product manager, a lead engineer, or another role who can carry it through delivery. Without an owner, a recommendation is just floating in space, and floating recommendations almost always eventually sink.
Calculating the RAS
To calculate the RAS, each recommendation should have a status and a value rating.
RAS Status Categories
One of the easiest places for breakage to hide is in vague statuses like In Progress. That phrase can mean anything from “we are actively working on it” to “someone glanced at it once.”
RAS cuts through that by sticking to clear, verifiable statuses.
- Adopted indicates that the recommendation has shipped, the fix has been put into action, and the researcher has verified that it was implemented as intended. The recommendation does not need further work and is in its final, completed form.
- Committed indicates the recommendation has been scoped and resourced. Verbal promises such as “we’re going to get to that soon” do not count. The recommendation must be in a release plan or roadmap. Committed recommendations should be reviewed regularly as product plans may change, and this status should not be used to indefinitely postpone addressing certain recommendations.
- Communicated means the recommendation has been delivered and acknowledged, but is not on a direct path to adoption yet. In other words, a researcher has provided a clearly written research-based recommendation that identifies a clear fix. The recommendation has been handed off to the product team, but no plans or actions have occurred yet. Ideally, communicated recommendations should move to the next status within 60 days of being communicated.
- Canceled covers the cases where adoption is not happening because the recommendation was rejected, deferred, or is no longer relevant. For example, if a recommendation suggests that a feature needs to be made more usable, but the business stops supporting that feature, then the recommendation is no longer relevant and is considered canceled. Canceled items are excluded from the scoring pool altogether.
These statuses make it harder for recommendations to disappear into limbo, which is where most breakage occurs.
RAS User-Value Ratings
Recommendations can come from all types of research, including evaluative, generative, or exploratory. When calculating the user value of a recommendation, we consider both status of the recommendation (Adopted, Committed, or Communicated) as well as value to the user.
Adopted Recommendations
These are recommendations that are already in production and fulfilled their mission. However, not all adopted recommendations are equally important. Some recommendations fix mission-critical blockers. Others smooth smaller friction points. Some are cosmetic. If we were to treat them all the same, it would make it easy for teams to game the system by implementing only the easiest fixes. Therefore, the user value of an adopted recommendation will depend on the impact of that recommendation:
- 3 points (high value): These recommendations address major problems tied to retention, adoption, or core task success. They lead to changes that users notice immediately. If the fix goes in, the product feels different in an obvious way.
- 2 points (medium value): These recommendations address important friction points, but the impact may not be as visible to all users. The fix improves the experience, but it might be noticed only in specific situations or by users who perform a specific task frequently.
- 1 point (low value): These fixes provide minor or cosmetic improvements. By themselves, they are unlikely to be noticed at all. They may polish rough edges or remove tiny irritants but will not shift overall perception.
- 0 points (no value): These are cancelled recommendations covering cases where adoption did not happen because the recommendations were deferred, rejected, or no longer relevant.
Committed Recommendations
Committed recommendations are scoped, resourced, and placed in a release — but not yet shipped. They deserve some credit. We know that big fixes take time. Some require design work, cross-team coordination, or engineering effort that does not happen overnight. But, until they ship, these recommendations are still at risk. This is why committed items earn some “credit,” but less than an actual adopted fix.
The user value of a committed recommendation is 0.66 points, regardless of the potential impact of that recommendation.
Note that a committed recommendation, even a high-impact one, is worth less than any adopted recommendation. The rationale is to ensure we do not overvalue committed recommendations, thus reducing the motivation to get to full adoption.
Communicated Recommendations
We believe that a recommendation that is not yet on the path to adoption should not be considered in the RAS, and therefore, a communicated recommendation has a user value of 0.
Canceled Recommendations
These recommendations are removed from the set of recommendations over which the RAS is calculated. They are not considered in the calculation because they are no longer relevant, or have been rejected or postponed indefinitely.
The table below summarizes the scoring of the user value.
|
|
Recommendation Impact |
User Value (Points) |
|---|---|---|
|
Adopted recommendations |
High value |
3 |
|
|
Medium value |
2 |
|
|
Low value |
1 |
|
Committed recommendations |
All (high, medium, or low) |
0.66 |
|
Communicated recommendations |
All (high, medium, or low) |
0 |
|
Canceled recommendations |
All (high, medium, or low) |
No value --- removed from calculations |
A backlog filled with low-value adopted recommendations might produce activity, but it will not meaningfully change user experience. A few high-value recommendations, on the other hand, can alter the directions of a product. This weighting system ensures that the user-value score reflects potential, impact, and output.
Recommendation-Adoption Score: The Formula
First, you will need to decide on a feature, product, or program whose recommendation breakage you’d like to track. RAS can be calculated at different levels of granularity depending on what makes sense for your team's structure and research cadence. At Cisco, we track RAS at the product and program level. Our research often involves multiple studies on the same product over time, and aggregating recommendations across those studies gives us a clear picture of overall adoption health.
That said, some teams may find value in tracking RAS per study, particularly if studies are infrequent, large in scope, or focused on distinctly different features. A study-level RAS can help identify which types of research generate the most actionable recommendations or which product areas struggle with adoption. The key is to choose a level of aggregation that provides useful insight without creating reporting burden.
Next, gather all the recommendations pertaining to that feature. We recommend starting with recommendations from the past 12 months. Going back further creates unnecessary archaeological work and risks including recommendations that are no longer relevant. If you have less than a year of research, start with what you have. Calculating your baseline RAS should emphasize pragmatism, not perfectionism. Remember, your first RAS is just a starting point, not a verdict.
With those definitions in place, here is the calculation of the RAS for that feature.
RAS = Actual user value ÷ Total possible user value x 100
Variables:
- The actual user value is the sum of the user-value ratings for all recommendations. This value will take into account the impact of the adopted recommendations, will weigh committed recommendations as 0.66 points regardless of impact, and will ignore unadopted recommendations (as described above).
- The total possible value is the sum of all uncancelled recommendations’ user values, assuming that they are all adopted.
Multiplying by 100 puts the score on a 0–100 scale that is easy to interpret and compare.
Example RAS Calculation
Say your research produces the following recommendations:
|
Recommendations’ impact |
Number of recommendations |
Possible user value |
|---|---|---|
|
High value |
3 |
3 x 3 points = 15 points |
|
Medium value |
6 |
6 x 2 points = 12 points |
|
Low value |
9 |
9 x 1 points = 9 points |
|
Cancelled |
2 |
Not considered |
|
Total |
18 |
36 points |
After communicating your recommendations, the following occurs:
|
|
Number of recommendations |
Actual user value |
|---|---|---|
|
Adopted |
|
|
|
High value |
2 |
2 x 3 points = 6 points |
|
Medium value |
3 |
3 x 2 points = 6 points |
|
Low value |
4 |
4 x 1 points = 4 points |
|
Committed |
1 |
1 x 0.66 points = 0.66 points |
|
Communicated |
8 |
8 x 0 points = 0 points |
|
Total |
18 |
16.66 points |
So the RAS is: RAS = Actual user value ÷ Total possible user value X 100 = (16.66 ÷ 36) × 100 = 46.3.
That lands in the Fair range (see below). Some improvements happened, but more than half of the value identified in research never made it to users.
Interpreting the Recommendation-Adoption Score
Through scenario modeling, we defined the following ranges to help us interpret RAS scores.
- Poor (0–29): Teams largely ignore research. Maybe one or two minor items were fixed, but the impact is negligible. This range feels like failure.
- Fair (30–54): Some movement, but not enough to change outcomes. A single big item might have been adopted, but most value stays locked in backlogs. It is progress without momentum.
- Good (55–79): A majority of medium- and high-value recommendations are adopted or committed. Users begin to feel the improvements. A rule of thumb is that it only takes adoption of around half of the recommendations to get to this status.
- Great (80–100): Rare territory. Teams act on almost everything that matters, especially high-value fixes. Research is respected, and adoption is part of the culture.
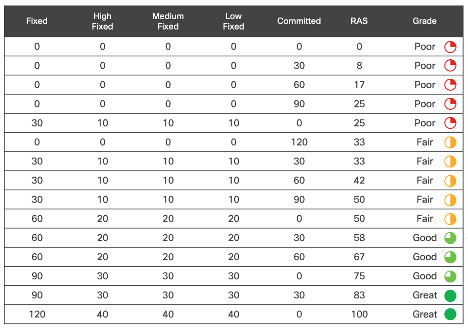
Again, the goal is not perfection. The goal is fairness. Most organizations should aim to be in the Good range. That range shows that research is being taken seriously even when it’s not possible to adopt every single recommendation.
Note that the score will depend on when you start measuring. If you are in the early stages of defining a new feature, your scores will be low. Similarly, RAS will naturally dip when new research introduces additional recommendations. These new recommendations enter the calculation as Communicated (value = 0), resulting in a temporary decrease in the overall score. This fluctuation is expected and healthy, as it means research is actively informing the product. As those recommendations move to Committed or Adopted status, the score will climb again. Ultimately, your RAS-score trendline is more important than an individual data point.
How Long Should You Track?
Once you have established your baseline RAS, we recommend that you continue calculating it using a rolling 12-month window so that your RAS reflects all recommendations from research conducted in the previous year. This window is long enough to account for the reality that meaningful recommendations take time to implement, while also keeping the metric reflective of the most recent work of the team.
A yearly window is just a suggestion, however. Teams should feel empowered to adjust this window based on their own velocity, capacity, and organizational maturity. A team with rapid release cycles and strong adoption patterns might use a shorter window — perhaps six months. A team working on complex enterprise software with longer development timelines might extend the window to 18 months. The key is choosing a timeframe that captures enough data to reveal trends without letting old recommendations dilute the signal.
A regular grooming practice will keep the system honest. For a 12-month window, review recommendations at least annually. Recommendations that have been Adopted for more than 12 months should be removed from active tracking. Those recommendations have fulfilled their purpose. Additionally, Communicated and Committed items that are over a year old should be examined. If they have not progressed, it may be time to mark them as Canceled and have a direct conversation about why adoption stalled.
Expect the first year of tracking to be bumpy. You are building history, establishing ownership norms, and learning what adoption looks like in your organization. Early scores may be low, but that is normal. Focus on overall improvement rather than any single result.
A Real Example of RAS in Practice
When we first introduced RAS in our own organization, the numbers were uncomfortably low. The initial score fell squarely in the Poor range, which confirmed what many researchers already suspected: recommendations were not making it through to delivery.
But here is where the value of RAS came into focus. As we began to clarify recommendations, enforce ownership, and use honest statuses, the score steadily improved. Within a few months, our rolling average was climbing into the Fair range. Then, one year later, we reached Good.
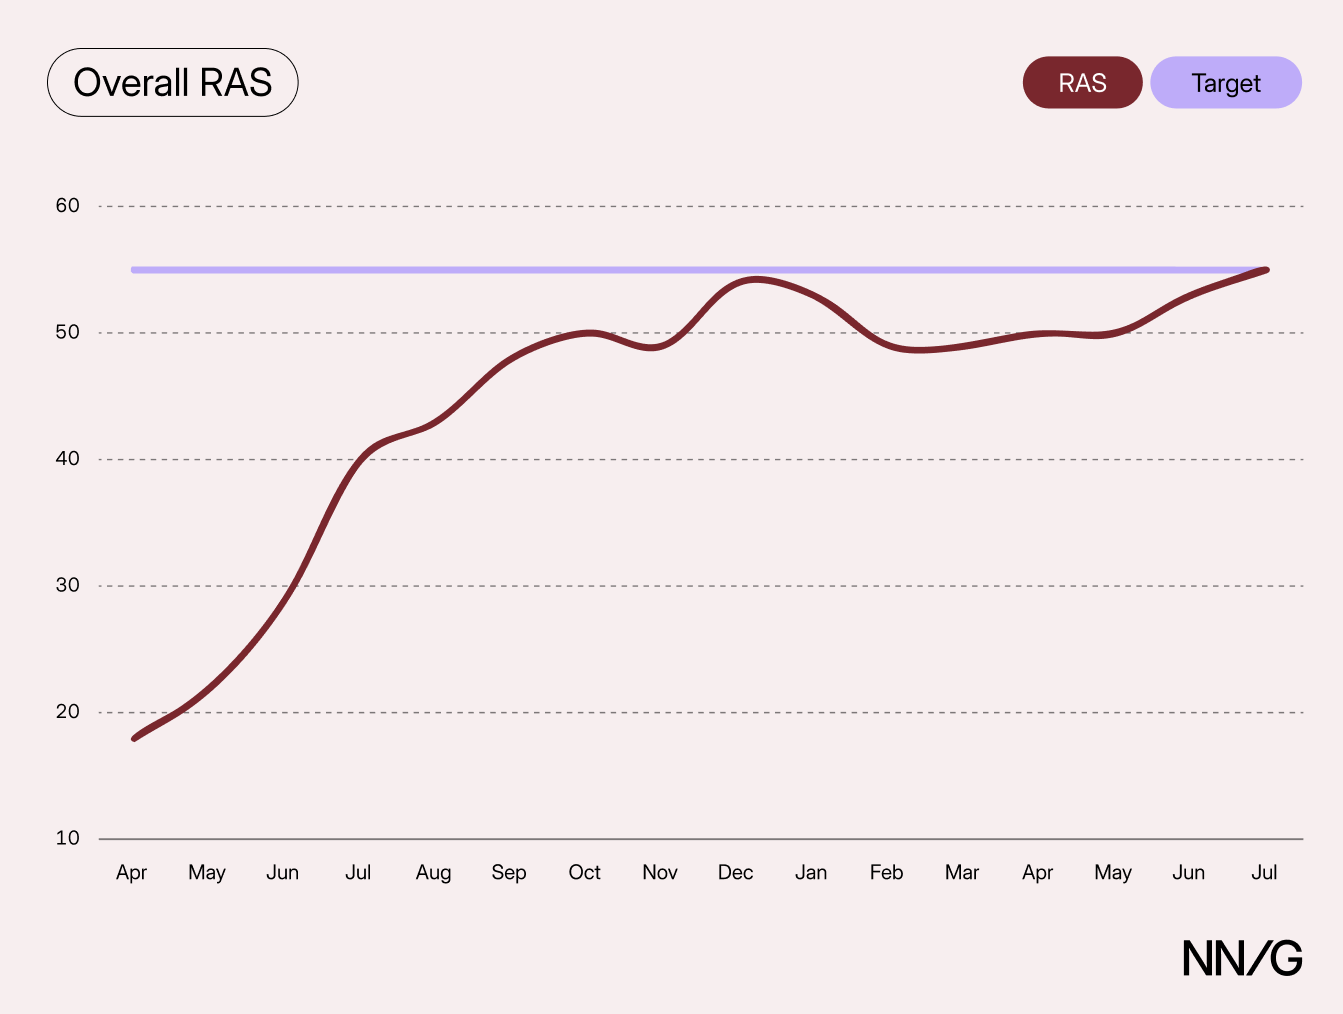
The lesson was not that adoption suddenly became perfect. It was that simply tracking adoption started conversations that had never happened before. Suddenly, product teams knew their adoption rates, executives could see the trend, and researchers finally had proof they could use to push for change. The steady climb in RAS turned adoption from something invisible into something visible, measurable, and actionable.
Understanding RAS Trends over Time
A single RAS score is useful, but a trend over time is far more telling. Scores will naturally fluctuate as new research is conducted and recommendations move through the adoption pipeline.
When new research introduces additional recommendations, they enter the calculation as Communicated (value = 0), which temporarily lowers the overall score. As those recommendations move to Committed or Adopted status, the score increases. This rhythm of dips followed by rises is exactly what healthy adoption looks like. It means research is happening regularly and recommendations are progressing.
Plotting rolling RAS over a larger period of time (like a year or more) reveals the underlying pattern. If the trend line is climbing, adoption is improving. If it is flat, progress has stalled. If it is dropping, breakage is getting worse, and new recommendations are piling up faster than old ones are being addressed.
What you should worry about is a dip that never recovers. If your RAS drops after new research and stays low for two or three quarters, that signals a breakdown in the adoption process. Trends are what separate temporary setbacks from systemic problems.
What RAS Is and Is Not
RAS measures the system, not the individual researcher or study. It can indicate a collaboration problem between researchers and product teams, but won’t tell you exactly where the problem lies. The researchers' own rigor, clarity, and connection to evidence. They do not own roadmaps or engineering bandwidth. A low RAS does not mean a researcher failed. It means value was lost between research and delivery.
At the same time, RAS serves as a feedback loop. If recommendations routinely go nowhere, it is worth asking if they were framed clearly enough, or if they were tied tightly enough to evidence. We should always look inward first to ensure we’ve done all we can to execute solid research and communicate it effectively.
Where We Go Next
Calculating RAS is only half the story. Knowing the number tells you where value is breaking down. The next challenge is knowing what to do with that information. In the next article in this series, we will look at how research leaders can use RAS to guide team resourcing, prioritize work, and match researcher strengths to the right opportunities. The focus shifts from math to management, from how to calculate adoption to how to use it to make better decisions.