An empathy map is a visualization that captures our understanding of a set of users. It is a simple yet powerful tool for making sense of user research and communicating what we know about our users to design-team partners and stakeholders so that we can discuss and prioritize user needs collaboratively.
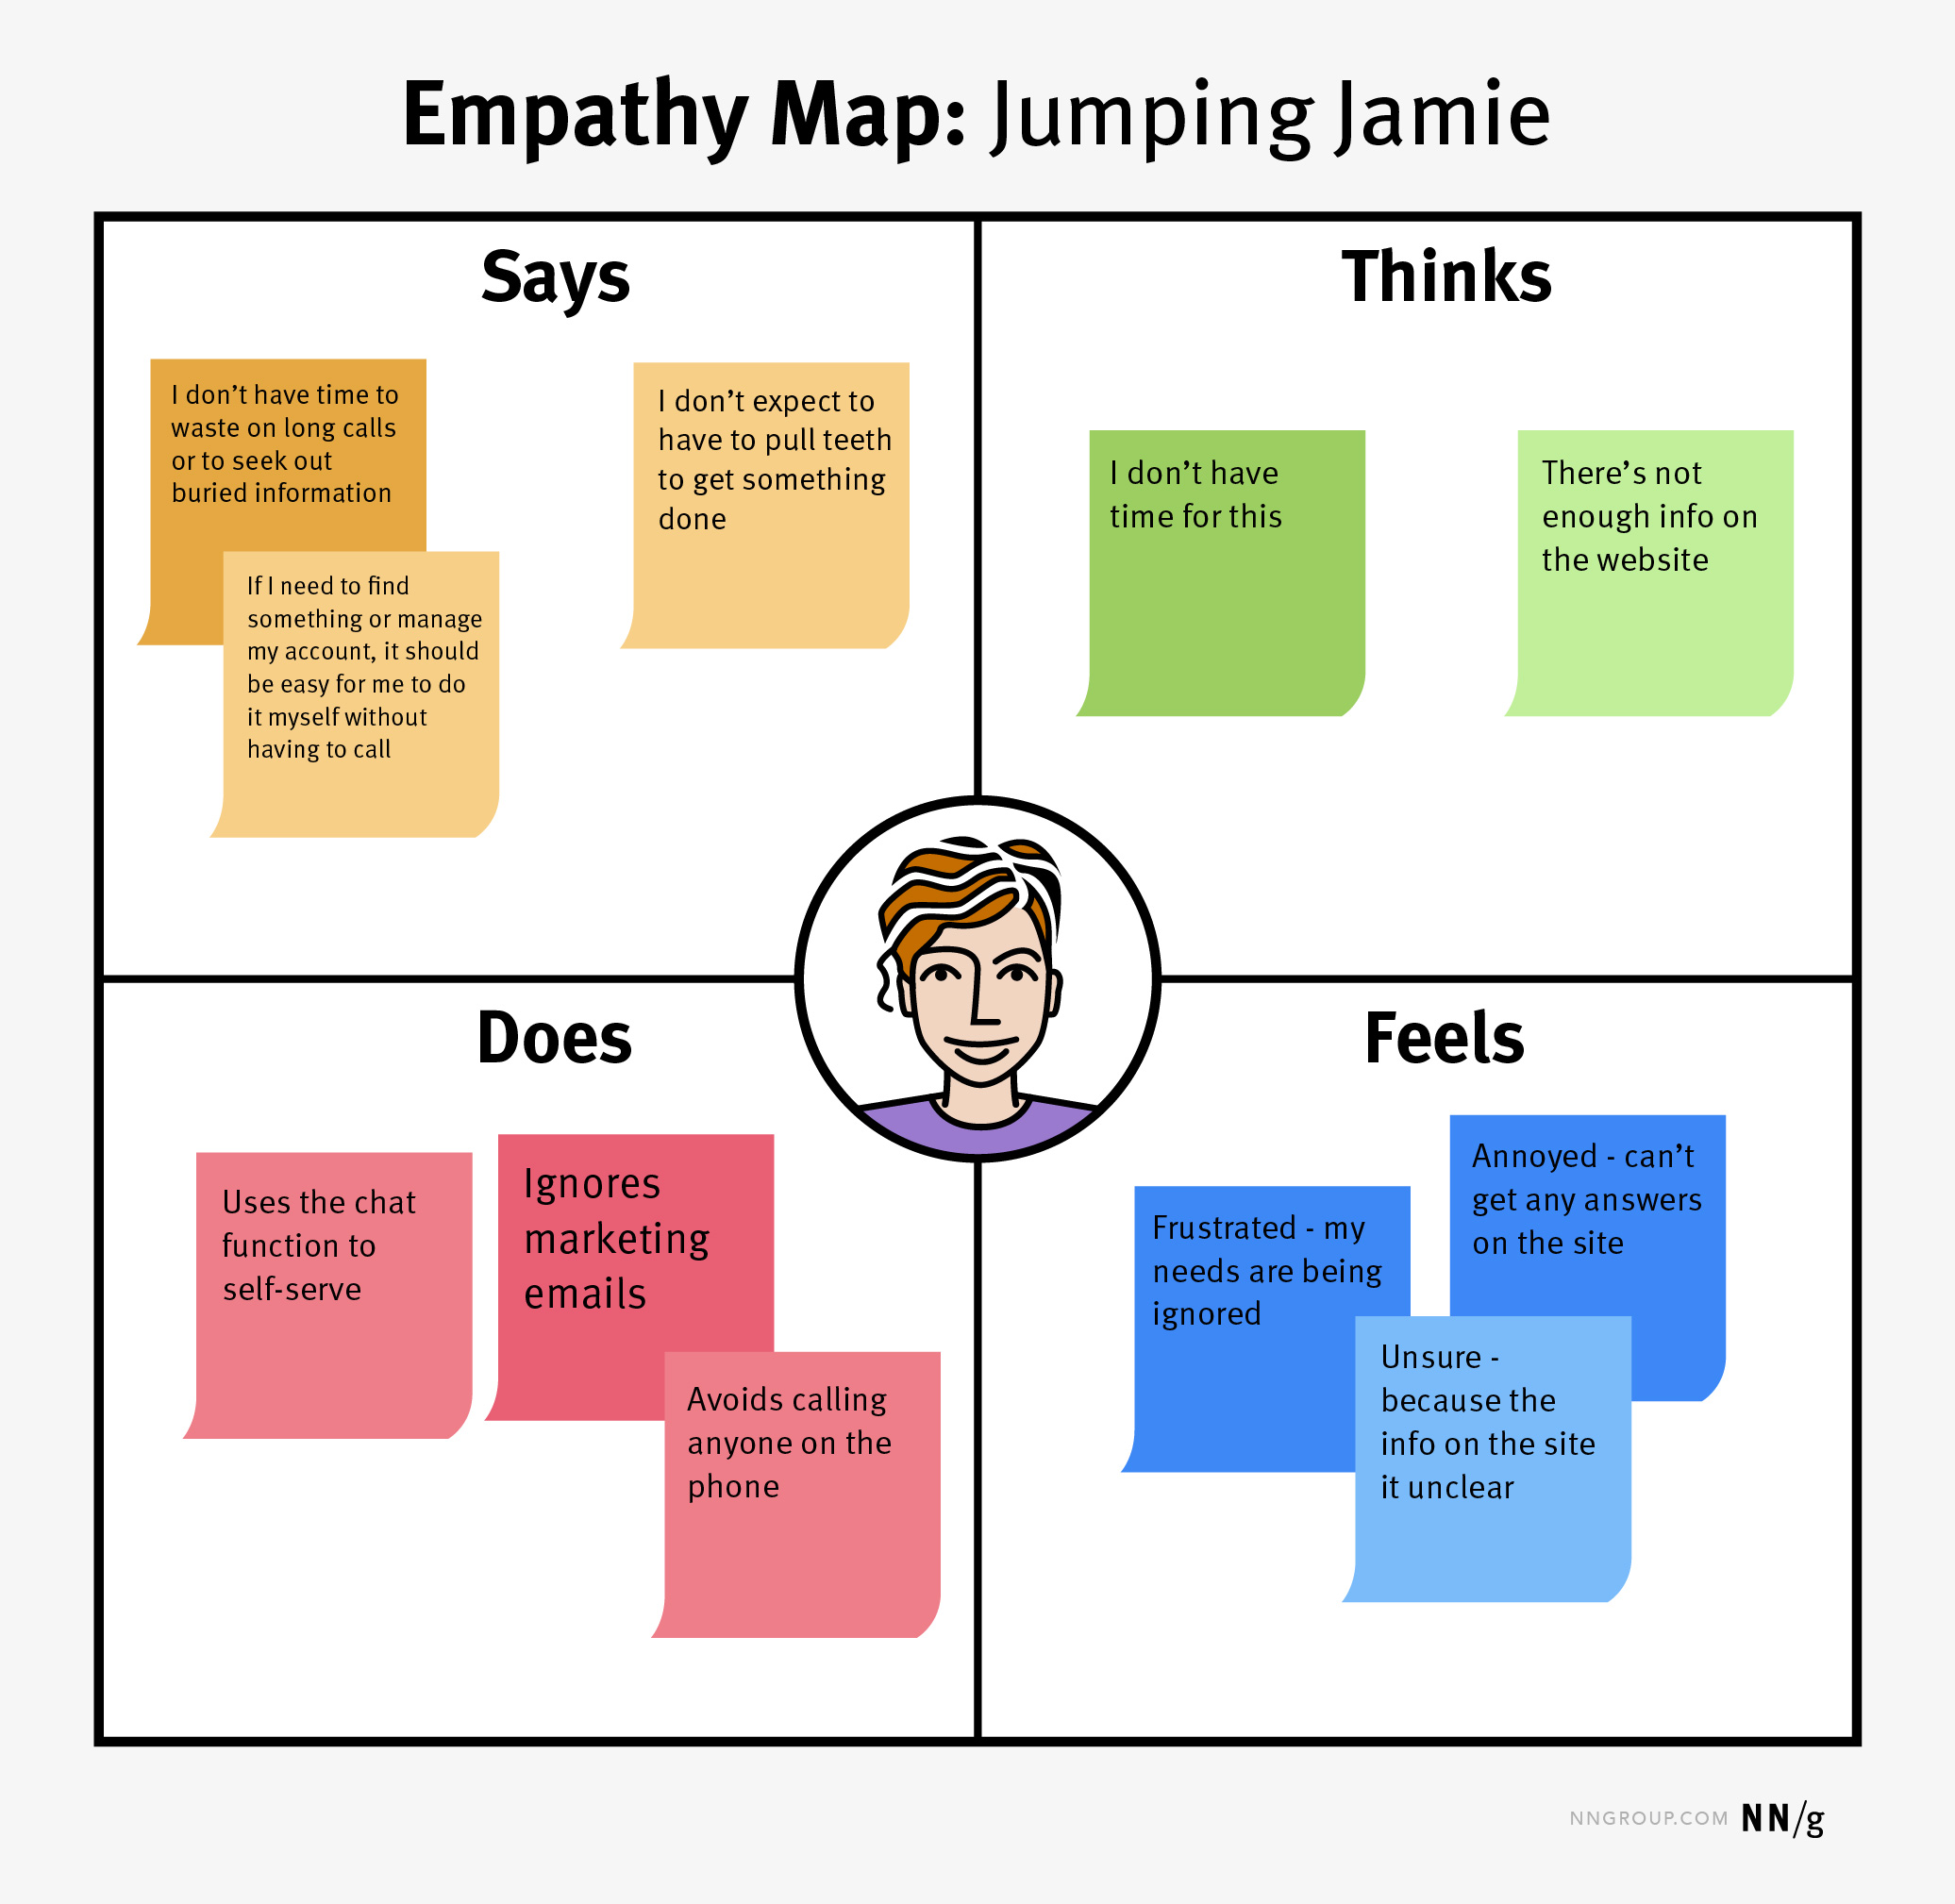
Traditional empathy maps have a 4-quadrant structure, with equal space devoted to capturing what the user:
- Says: Direct or paraphrased representative quotes from users
- Thinks: Users’ thoughts, motivations, and needs framed in first-person statements
- Does: Typical or observed user behaviors and actions
- Feels: Users’ emotional states during the process
These quadrants surround a depiction of the persona or user group in question.
While it’s fairly easy to grasp the simple format of an empathy map, some teams struggle to figure out how the tool fits into the overall design process. When is the best time to create an empathy map?
Empathy maps are flexible. They can be useful at various times throughout the design process, including:
- Before research has happened, to plan and shape future studies
- During research, to capture users’ needs, attitudes, and experiences
- After research has been conducted, to communicate research findings and build understanding of our users
Empathy Maps to Plan Future Research
Many people primarily think of empathy maps as a method for documenting insights from research that has already happened. While that application is useful, empathy maps can also be a powerful tool for planning and shaping future research endeavors.
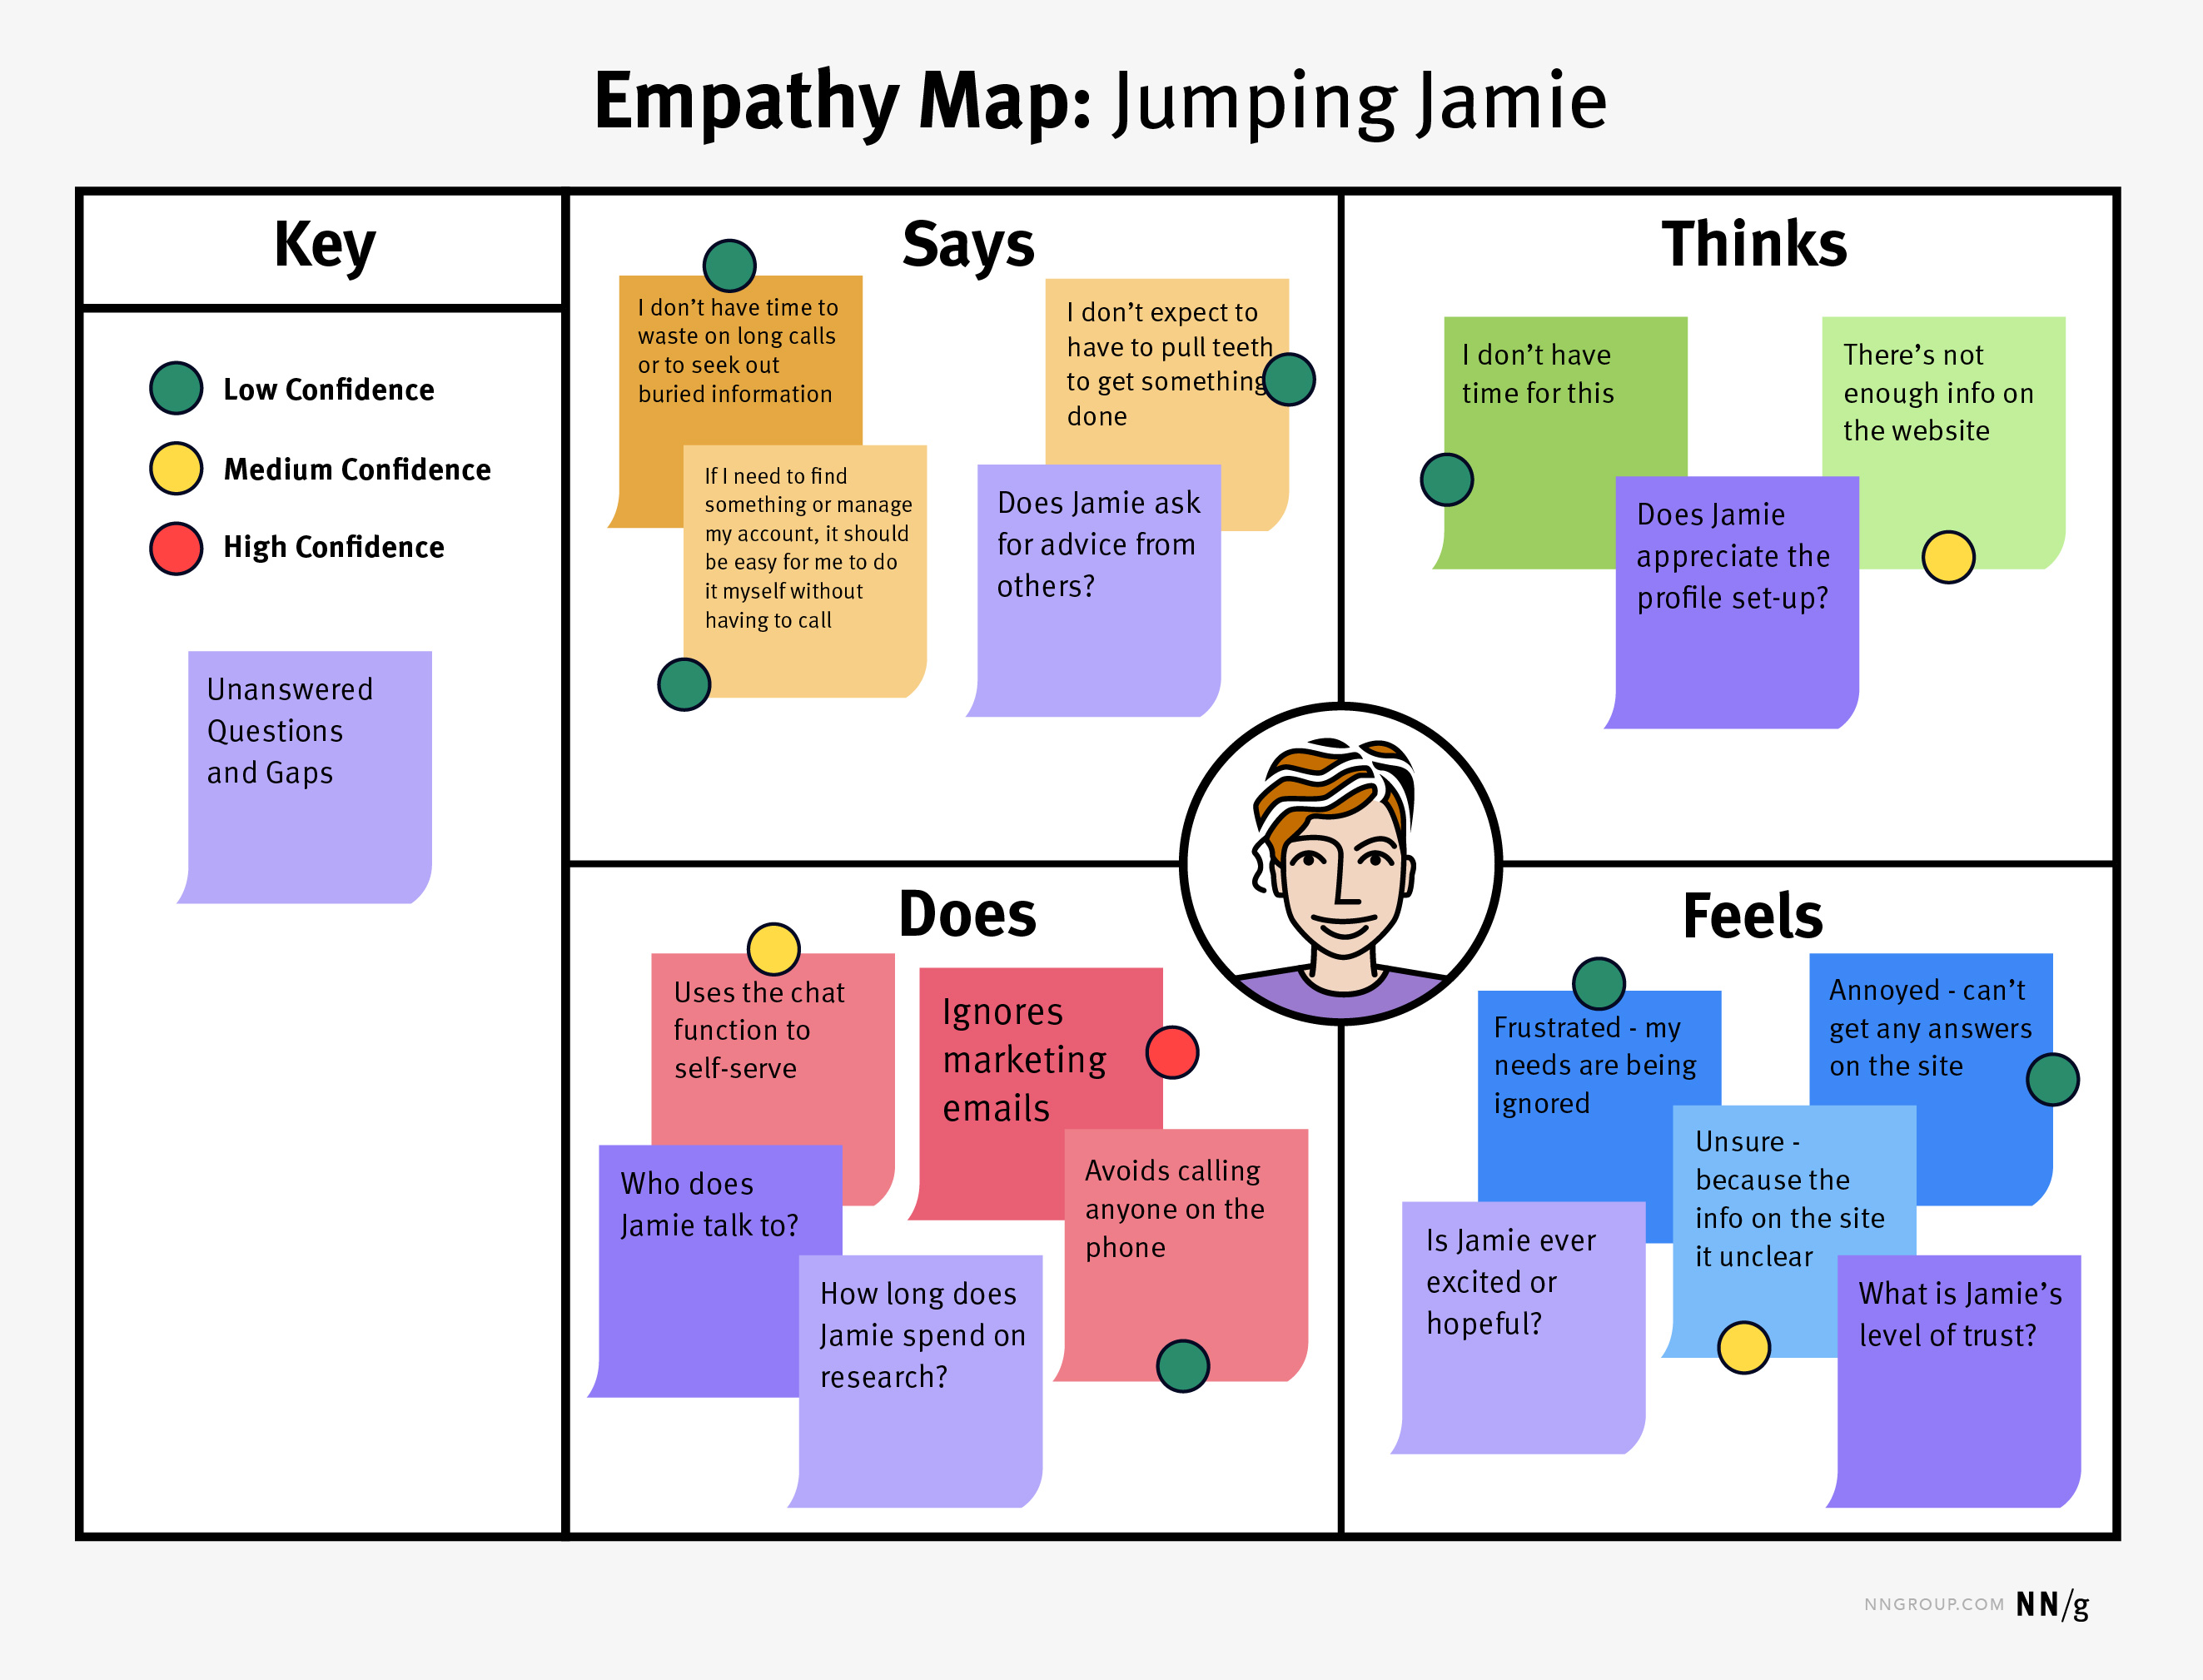
When planning future research, teams can use the same 4-quadrant structure to assess gaps and unknowns about a particular user group. During a collaborative activity, direct the team to document what it currently knows about the user group in focus. The team should devote time to each quadrant, documenting things that team members believe users say, think, do, and feel. Place each known item on its own sticky note. Those sticky notes are then assigned to the relevant quadrant on the map.
If no new research has been conducted in quite some time (or ever), consider assigning a confidence rating to each item — with 1 = low confidence, 2 = medium confidence, and 3 = high confidence.
After capturing current knowledge, the team can step back and reflect on what’s missing, asking: Where are there gaps? What don’t we know? What are we most unsure about? The team could use the map to document these questions, which should inform future research studies.
Empathy Maps to Capture Insights During Research
You can also use empathy maps for documenting observations during user research. This method works especially well when observers are not researchers. The 4 empathy-mapping categories are approachable and understandable, so most people are able to effectively use them as a guide for logging useful insights, even if they are not in a design or research role.
After explaining the categories, provide observers with 4 different colors of sticky notes, each one pertaining to a different empathy-mapping category, and instruct them to capture notes during each session (one observation per sticky note). After the sessions are finished, the group can post up and discuss all the observations using the empathy-mapping structure as a landscape. Follow this activity with an affinity-diagramming exercise to cluster similar observations into groups and extract themes.
You could also use the empathy-map framework during the user-research session as a tool to help study participants directly document and share their attitudes and experiences about a particular process or topic. When maps are filled in by actual users, researchers may uncover useful insights that they wouldn’t have thought to ask about during a user interview or observed during a time-limited observation session.
Empathy Maps to Help Others Understand Previously Conducted Research
Finally, empathy maps can be used post research as an artifact for aggregating and consolidating research findings so that they can be communicated to others. This is, perhaps, the most common use of empathy maps, and for good reason: The simple structure is engaging and easy to navigate for most people.
While the research role or team could create the maps independently to share out as research artifacts, this approach is especially impactful when conducted as a collaborative activity. Share existing research with the greater team and, as a workshop activity, have everyone collaboratively create empathy maps based on the data. As individuals read through the data (e.g., interview transcripts, diary study logs, qualitative surveys) have them fill out sticky notes that align to each of the 4 quadrants. Like in the method described in the previous section, team members can then post their sticky notes to the map and use an affinity-diagraming exercise to facilitate discussion and consolidation.
Not only does this approach create an artifact that communicates research findings in an approachable way, it also builds buy-in and ownership of the research because it invites the wider team to engage with the findings and collaboratively discuss and make sense of them.
Conclusion
Empathy mapping can be used before, during, or after research to engage teams and communicate insights. Because of its simplicity and flexibility, opportunities for empathy mapping exist throughout the design timeline, where it can be used to:
- Identify unanswered questions to plan for future research studies,
- Log observations (or even data directly from users) during research.
- Create a compelling artifact to communicate user-research findings after research has been conducted.